
03 Sep Getting on Top of Instagram Stories Analytics
Getting on Top of Instagram Stories Analytics – Understanding How to Measure the Metrics That Count
One study suggests that 62% of Instagram users admitted that they became more interested in a brand or product after they saw it on Stories.
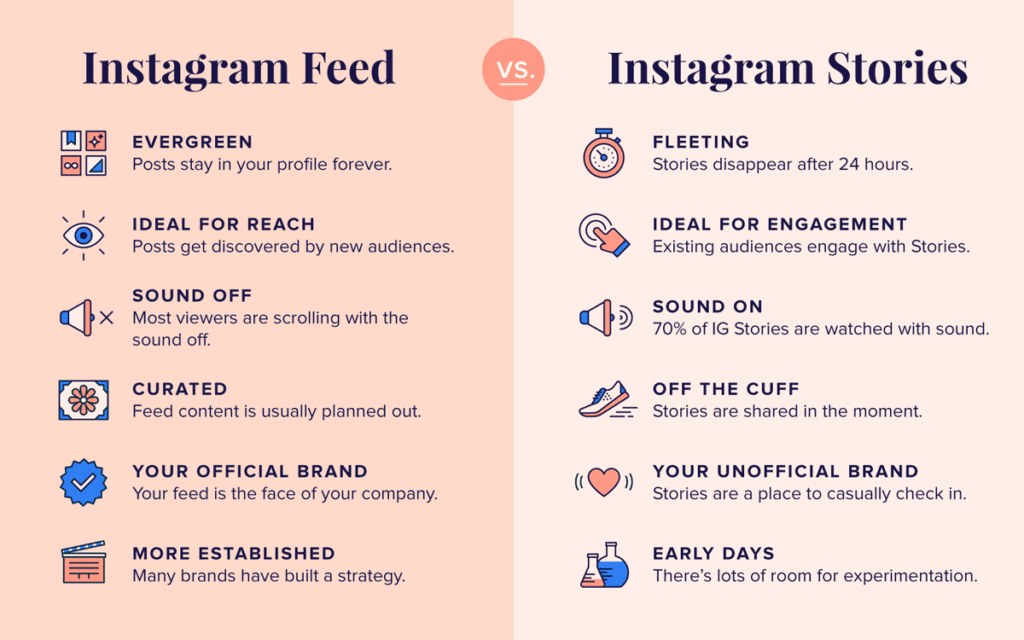
Even though Instagram Stories have a life of only 24 hours, businesses love them because they integrate very well with the regular feed while adding a touch of the distinctive personality of the brand informally that helps audiences to connect with it better.
According to searchenginejournal.com, the daily user count of Stories is more than 500 million.
In January 2019, the photo-sharing platform Instagram reported 500 million daily active Stories users worldwide, up from 400 million global DAU in June 2018. Instagram Story is a feature of the app allowing users post photo and video sequences that disappear 24 hours after being posted.
With Stories becoming so lucrative for raising brand awareness and boosting engagement, businesses need to monitor their Instagram Stories analytics closely.
A brief primer on the use of Instagram Stories analytics:
Three Categories of Instagram Stories Analytics
Discovery
Among the main metrics, you should track reach and impressions.
Your reach rate will depend on the size of your audience. This means that the more followers you have, the lower your stories reach rate will be. – Social Insider
The reach refers to the number of unique followers that viewed your story while the impressions are the total number of times the story was seen, including repeat views.

The discovery statistics are vital because it is established that 62% of Instagram users admitted to becoming more interested in products and brands after seeing them in Stories.
Your Instagram Stories aren’t just for your present followers.
The ideal approach to boost your Story discoverability is to utilise the hashtag and location stickers.
The analytics include the number of forwarding back, next story, and exit story taps made by viewers.
Taps forward can signal that maybe some parts of the story slide is boring or not giving enough information so people want to jump straight to the end (taps forward) in order to get the idea of the story. – EmbedSocial
They are important because by studying them, you can find out how your target audience is behaving when they see your story.
You can be sure that your stories are not proving to be interesting is there are many taps for the next story or taps for exiting from Stories, however, back taps indicate that your content is so impressive that users want to see it again, share it, or save it.
Another one worth mentioning here is the Sticker Taps, which shows the number of times people have tapped on a hashtag, location tag, mention, or product sticker on your Story. – Embed Social
The following metrics are the thing that you can follow when users are exploring and navigating on Instagram Stories analytics.
Taps Forward – The all outnumber of taps your story received for the following photograph or video.
Taps Back – The all outnumber of taps your story got for the past picture or video.
If you’re seeing that your Story is getting a lot of tap backs, check what was the Story posted right before it. – Iconosquare
Exited – The all outnumber of taps to leave your story.

Story Replies – Total tally of responses given to your story.
Next Story – The all outnumber of the taps for the following account’s story.
Link Clicks – The all-out number of times the link on your story was clicked.
Total Interactions – These analytics comprise the number of visits to your profile, replies to your story, the number of users becoming your follower after seeing your story, the number of times your story was shared as well as the number of times your website URL was clicked. It also includes other metrics like clicks on your stickers, people clicking on the buttons for making calls, sending emails or getting directions, product page views, and page views per product tag. Total Interaction metrics are essential for brands who want to use Stories for boosting engagement levels or initiate actions for driving conversions.
Measuring Stories Engagement
While there are no exact formulas for measuring the level of engagement, brands can use several approaches depending on what their goals were.
By dividing the reach of your stories by the number of your followers, you can calculate the percentage of followers that are seeing your stories.
Brands desiring to boost awareness or engagement should watch this parameter closely.
The benchmark is 5%; however, you can exceed this by making your Stories more exciting and livelier.
You can also buy free Instagram likes at very nominal costs from a reputed digital marketing agency to create a buzz around your posts.
Another way of measuring the effectiveness of your Stories is to divide the total number of impressions by the total reach to find out what percentage of your viewers took some action after viewing your Instagram Story.
Calculate Your Instagram Story Completion Rate Determining the overall completion rate of your Instagram story will tell you how many people have viewed it in its entirety. For example, if 100 viewers watched the first segment and 89 viewers watched the last segment, the overall completion rate is 89%. – SocialMediaExaminer

Another useful and more specific method of measuring engagement is to compare reach with a critical interaction that is best aligned with your marketing goals.
Step by step guide on how to calculate Your Instagram Stories Engagement Rate
There are no likes, comments, or saves on Instagram Story investigation.
In any case, you can utilise interactions like swipe ups, replies, and sticker taps to figure your engagement rate.
Swipe Ups

“Swipe ups” are the explanation everybody needs to hit 10K followers on Instagram.
Why?
Because it’s the only thing other than your bio or in the description of an IGTV video where you can add a link, however, the “swipe up” feature is only available to Instagram business profiles who have hit that 10K follower’s achievement.
When you have the swipe up feature, your Instagram Stories analytics will follow the number of times somebody has swiped up on a story.
This metrics is an excellent method to perceive what content is best for directing people and driving traffic to your website.
Story Replies
Much the same as with your photos and videos, individuals can comment on the various slides of your story.
In contrast to additional comments, however, Story Replies aren’t open, and end up in your Inbox, for your eyes only.

This implies that you’re probably going to get fewer replies for a Story than for the things you share in your general Instagram stream.
It is a smart thought to encourage replies, in any case, as Instagram rewards greater engagement in its algorithm (even, for Stories that sit independently at the head of the page).
A more obscure form of engagement is tapping on stickers in an Instagram Story.
The all outnumber of taps to every sticker you use in a Story is remembered for the Interactions section of your Insights, gives you whether the sticker gelled with your crowd or whether it sank wholly and suddenly.
Measuring Discovery on Stories
Discovery, unfortunately, is not as easy to measure on Instagram as engagement.
This is because Instagram makes no distinction between accounts that follow you and those who don’t.
While tracking reach is a good way of finding out how many accounts are viewing your stories on Instagram, watching out for the number of follows, profile visits, and clicks on the website link is better for estimating discovery.
These are the metrics that can give you an idea of the number of people who were not your followers but found the story interesting enough to click on your profile, become a follower, or even visit your website.
The number of shares is also an important metric that can have a snowball effect on the number of followers you gain.
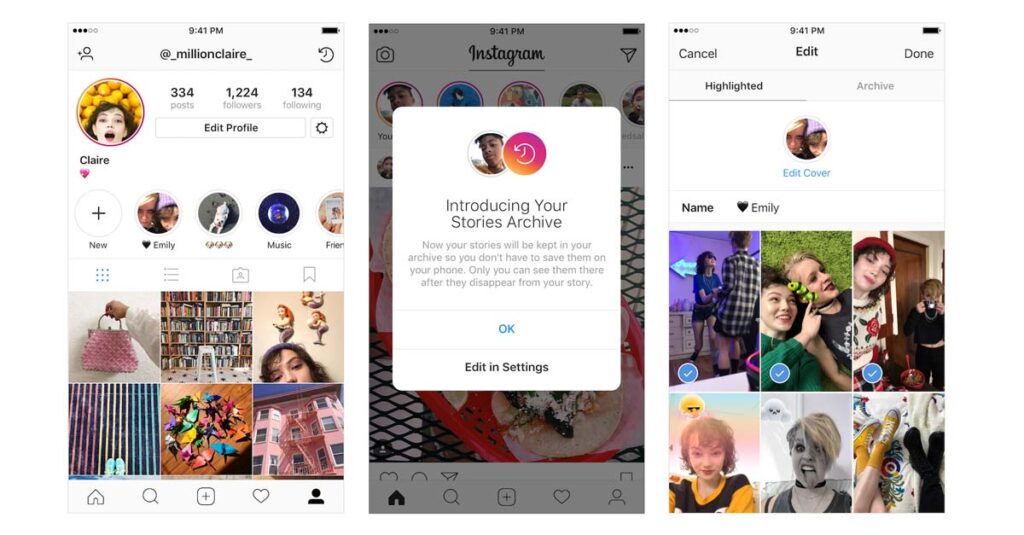
The recently-launched Growth Insights feature by Instagram allows you to identify the Stories as well as posts that led to the maximum number of followers.
Track the performance of expired Instagram Stories
Instagram Stories terminate and expire after 24h hours – and performance data disappears with them.
To defeat this limitation, we made a mechanism that tracks your accounts and gathers information like every 30 minutes.
This assists with improving insights into how the effect of your Instagram Stories creates over days, weeks, and months.
Measuring Stories Traffic
Compared to other social media platforms, Instagram until very recently only offered a website link in the bio section to direct traffic out of the app.
Having your organic and paid Stories metrics side-by-side makes it easy to analyse your overall Stories performance. – Supermetrics
The rollout of the Swipe feature is a welcome change; however, it remains quite challenging to measure the number of people using the feature unless you add UTM parameters.
Another issue is that the Swipe Up feature is restricted to accounts that have more than 10,000 followers.
Since Instagram Stories have a life of only 24 hours unless they are added to the highlights, they must be posted only when your followers are active.
To figure this out, you need to click on the audience tab inside Insights and click on followers to find out the days of the week and the times of the day when your followers are mostly online.
Get a total picture with all Instagram data
Bind together with your Instagram analysis in one tool by combining information on your Stories with information on the overall performance of your Instagram business profiles.
Compare overall Reach or Impressions and your Instagram Stories and locate your best-performing formats.
Measuring Story Mentions
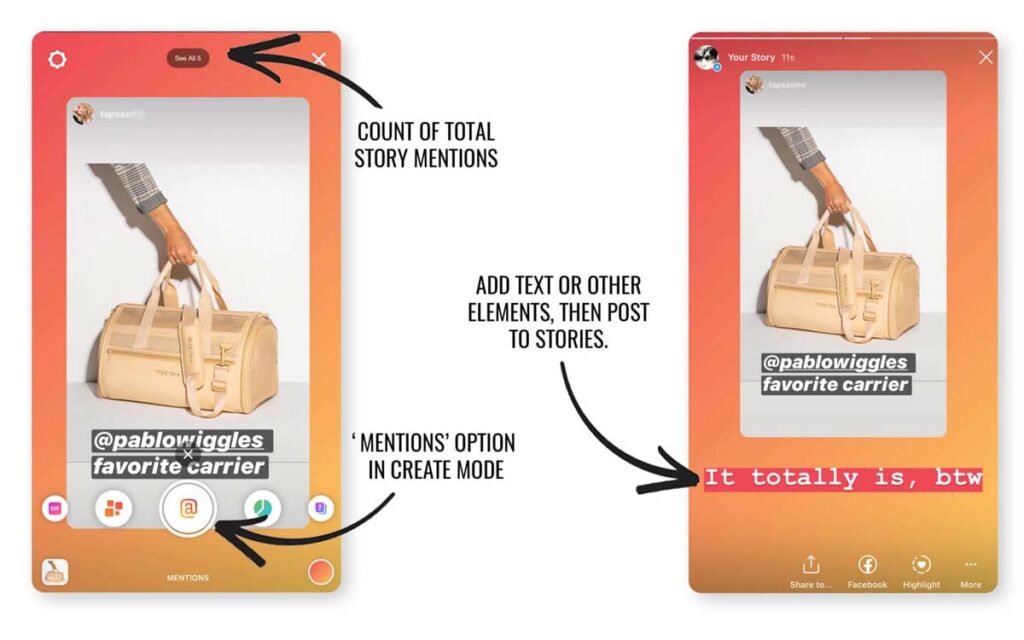
Instagram has recently made it easier for businesses to track the stories that mention them.
These Stories can now be seen right at the top of the Activity tab.
To access the Instagram stories of the active story, follow these steps: Tap on the current story Swipe up the story you are viewing It will open a bottom drawer view with the story insights Tap the (eye) icon to view the actual Instagram users who have viewed the story Tap the (chart) icon to view the insights for the story If you want to access the insights for Instagram Highlights, the above steps are the same. – EmbedSocial
You can investigate each story to find out how you have been tagged by tapping the heart icon and then clicking on Mentions under the tab, Stories about You.
Now you can add these stories to your own Stories while not forgetting to thank them for the mentions.
If you are a small business owner, you can use the Support Small Businesses sticker on your Stories; not only will you get more exposure but also able to access all the stories in which you have been mentioned in one place.
Conclusion
By tracking the key metrics over a period, you will be able to figure out which are your top-performing Stories and the reasons why they are so popular with your followers.
By understanding the kind of content that your audience likes, you will be able to create many more content concepts that will get your more engagement, brand awareness, and conversions.
Author Bio: Walter Moore is a blogger and digital marketing expert. He is quite experienced in the field of web marketing as well as website designing. He has written numerous articles and blog posts on topics related to social media marketing, technology, business etc.