08 Mar Web Analytics: 5 Ways to Understand Your Users
Web Analytics: 5 Ways to Understand Your Users
You must have heard people talking about how many visitors they have and even claiming a significant number of people have clicked.
Yet, this does not mean that the business uses the opportunities provided by website analytics successfully.
Like Google Analytics, data analytics provide us with useful insights about visitors, conversions, bounce rate, and much more.
But one thing that this data doesn’t tell us why certain phenomena keep happening.
The best way to do that is to use a wide variety of website analytics tools to help you out.
And this is still a pressing concern for many businesses worldwide.
Around 62% of all companies still have no data analytics strategy in place.
So you can stand above the competition and make sure you go ahead by utilising a variety of web analytics to understand your customers and get more conversions.
In this article, we’ll talk about the best ways how you can understand your users and customers with the help of web analytics.
What is Web Analytics?
It is a complicated statistic that lets you make a customised and precise analysis of your website’s attendance.
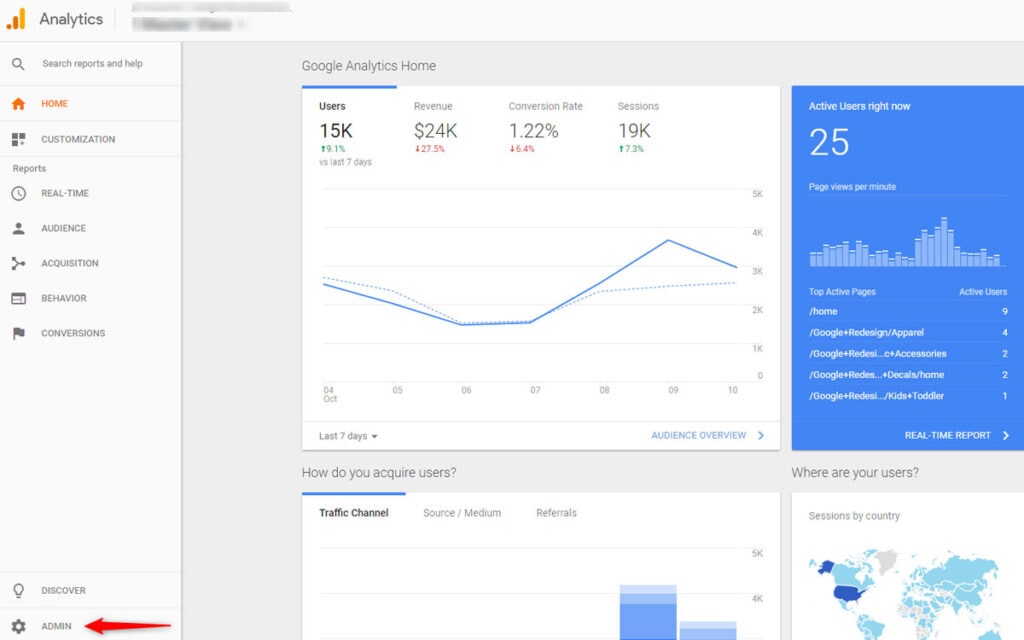
One of the most popular website analytics available is Google Analytics, which lets you track the number of visitors and other metrics for free.
More website analytics tools are focusing on quantitative and qualitative data of a website with the help of heatmaps, session replays, and other useful analytics platforms.
Through metrics, a company can alter its marketing activity online by updating the website to gain more traffic.
Why is Website Analytics so important?
Website analytics lets you do many things, from identifying traffic sources (web browser, search engine, device type, social media, etc.) to exercising more control over conversion rates.
Also, web analytics help you:
- Optimise the landing page – You can get great results by refining your landing page. The main aim of optimising the landing page is to minimise your website’s bounce rate.
- Find product-market fit – Website analytics is used to figure out what users search for on your website when they search and which pages they look for. With this information, you can fine-tune your content and find the topics you missed presenting in detail.
- Find the best place for CTAs – Call to action can be problematic if placed at the wrong places or places that are hard to locate. Your website’s landing page’s content should be consistent with CTAs if you want users to click on them.
- To identify pain points – Website analytics lets you know when and where visitors leave your website pages. The troubled pages have a higher bounce rate, and you must pay attention to them.
Where Do You Begin with Website Analytics?
This is one of the most complex aspects of many people. But it has a simple answer – you have to decide on your goals first.
Once you decide on the goal, you will know whether an indicator is a sign of failure or success, and it will help in understanding what changes are required for achieving the goals.
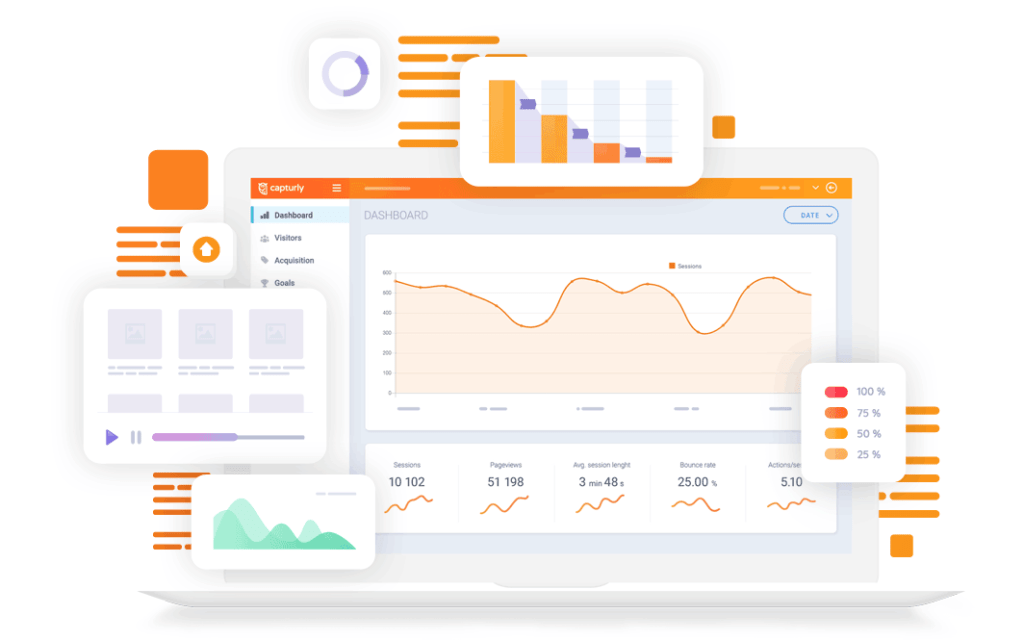
Quantitative Measurements And Traffic Sources
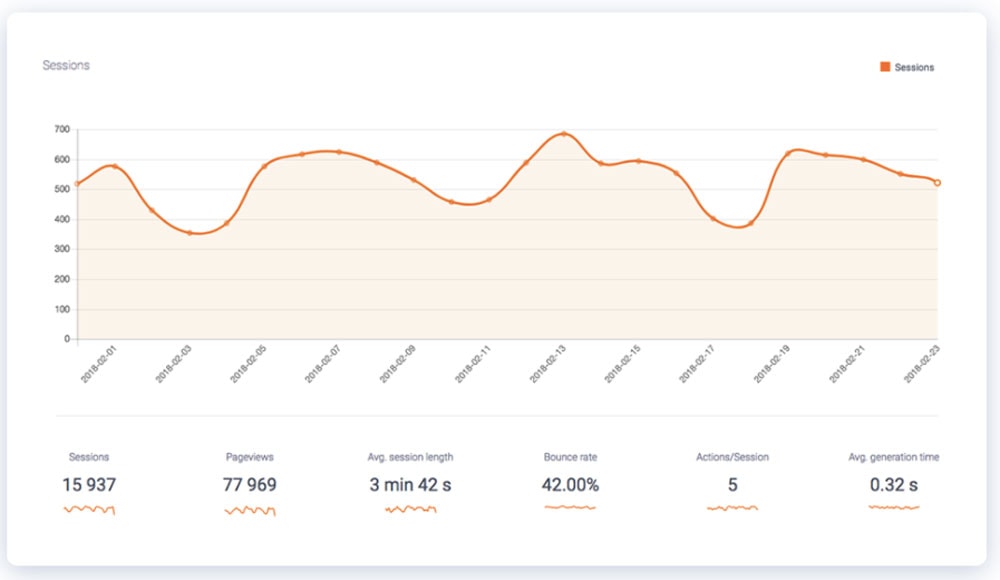
- Sessions – This represents how many visitors of your website interact with it within a certain period. Or how much time they spend on your website from visiting it till closing it. In Google Analytics, one session’s time limit is thirty minutes, after which a new session begins.
- Visitors/users – These are the individuals who interact with the website in some way. Users are determined by cookies used on their computers.
- Average visit length – This depicts how much time a visitor spends on your website on average.
- Bounce rate – It depicts how many visitors leave your website even before interacting with anything. If a page has a high bounce rate, you should pay attention.
- Pageviews – It shows the total number of views of pages on a website.
- Exit rate – It represents a particular page’s percentage of exits. It is different from the bounce rate because it is limited to a specific page while using the bounce rate for the entire website.
- Campaigns – refer to the traffic from particular campaigns that a company intends to analyse with web analytics, like the traffic coming from email marketing links, direct marketing, and social media pages.
- Direct – When a visitor opens your website by clicking a saved bookmark or typing in its URL. Bad redirects and unlabeled/poorly labelled links in a campaign are also considered direct traffic.
- Referral – It represents the traffic that comes from another website to your website.
- Search – It depicts the traffic from search engines. It can be classified into paid (when a visitor comes after clicking on a paid ad) and organic (when a visitor comes after searching on Google and other search engines).
These numbers, however, are not reliable because cookies are often blocked or deleted by a user, and the next time they visit your website, they will be counted as new visitors.
Additionally, users often bounce between multiple devices, and the second device will not have any cookies stored.
Qualitative Measurements And Other Useful Methods
Website heatmaps
They reveal which elements of a website are the best-placed according to the visitor’s attention, how the visitor reaches CTA buttons, and what content is in bad or good places.
Session Replay
It can be understood as a video recording of how a visitor interacted with your website. It is the most accurate tool.
Conversion funnels
It represents how well a website can perform when it comes to transforming visitors into actual customers.
Event tracking
It lets you track an event that took place on your website, such as downloads, loading flash elements, mobile ad engagements, video plays, etc.
A/B testing
It is a technique utilised in conversion rate optimisation, which lets you see which landing page, ad campaign, version of the website, newsletter, etc., perform better.
Goal Analytics
You can understand how close or far you are from your goal.
5 Ways to Understand Your Users with Web Analytics
We’ll discuss a variety of tools you can use, and you’ll become a master of understanding the “why” behind the numbers – which is what every online marketer wants, after all.
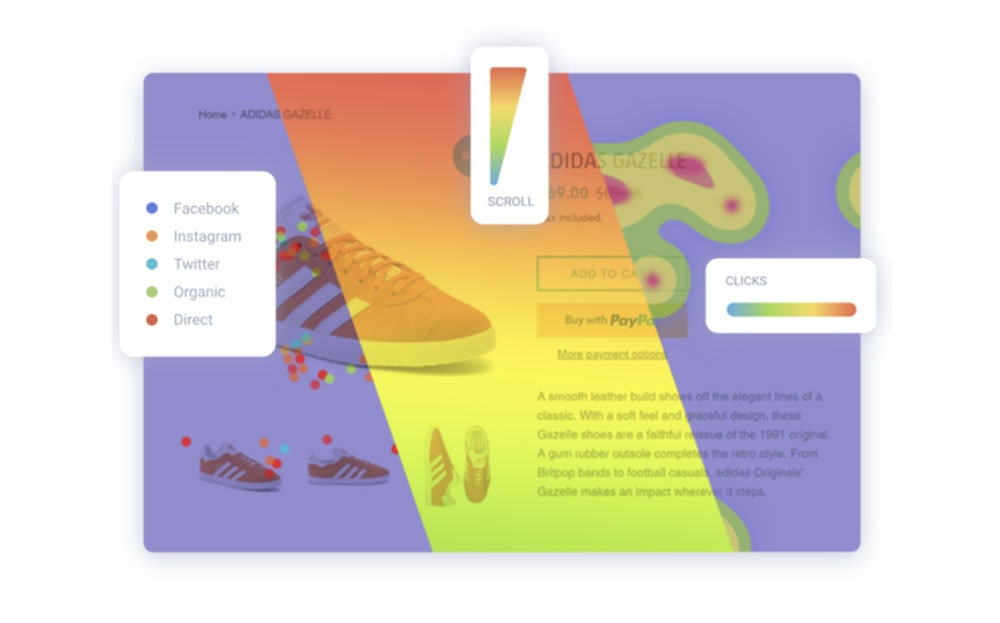
1 – Understand where Your Customers Click with Click Heatmaps
An essential thing that you need to get right if you’re an online marketer is your call-to-action buttons.
Whether you’re selling products online, or you’re asking your customers to take some action on your website, then you need to get your call to action right.
And one thing to get slightly more in-depth into this is with click heatmaps.
A simple method of telling where your users click, but it can provide you with useful insights that will let you understand your customers and your website better.
Are your links and CTA buttons working as they should?
Where are the users clicking, and do they use your CTA buttons as you designed them to work?
If your users are clicking on another button that the “Buy Now” or “Add to Cart” buttons, there is something wrong and needs fixing.
These maps will also help you uncover the rage clicks, broken links, and other hyperlink issues on your website.
This will help you understand your customers better and enable them to have a better user experience on your website.
After some time, this is bound to result in more conversions and sales.
2 – Get Into the Mind of Your Users with Session Replays
Session replays are still misused or are not used at all, and they are very overlooked when it comes to CRO.
The truth is that session replays are a valuable tool that will “teach” you how your customers navigate through your site and tell you how and where they move their mouse.
Ultimately, your goal is to guide your customers to click on specific elements and guide them throughout the whole sales process.
This starts when they enter the site, all the way to choosing the CTA button or link and completing the sale through the checkout system or cart.
The whole experience should guide and encourage the customer to complete the conversion, and with session replays, you can get some insight into how and why your customers behave as they do.
You can also understand if there is a high bounce rate on one of your pages.
You don’t want that happening on your sales page, and you certainly don’t want it happening on the cart or checkout page.
The best way to stop that is to fix the potential issues on those pages and minimise the bounce rates and improve the conversion rates.
But if you don’t know what’s wrong, then it might be hard to take action.
However, with session replays, you will know exactly why the numbers are as they are.
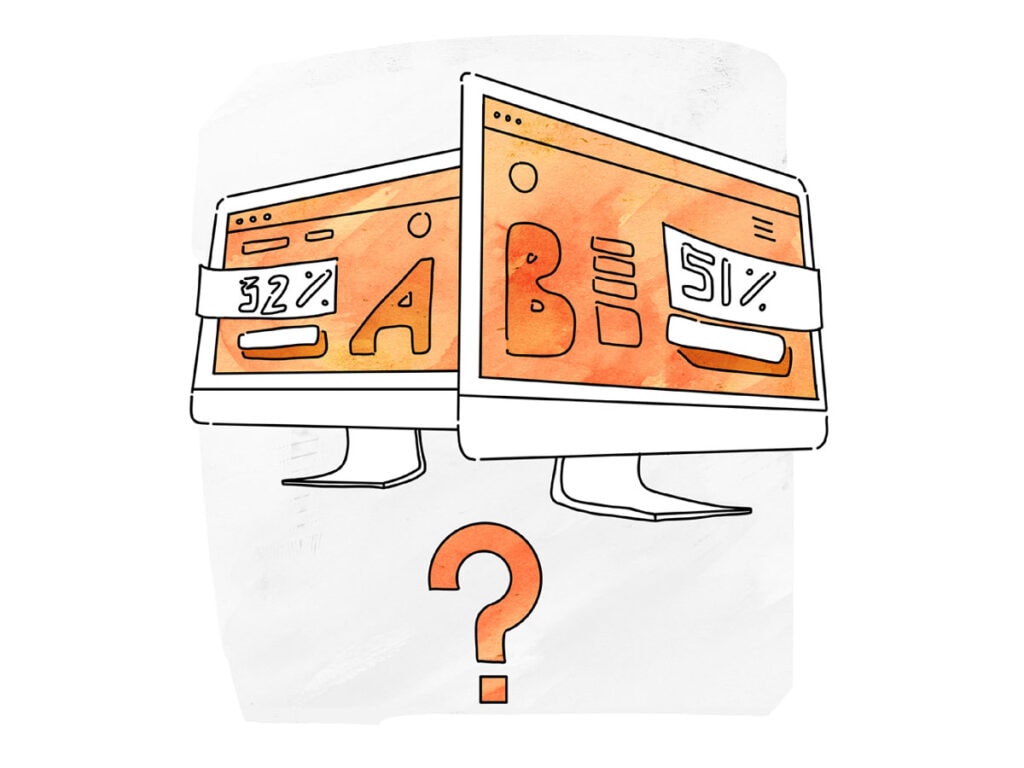
3 – Use A/B Testing to Understand Your Customers
Ultimately, there is no right or wrong way of how your site should be set up. What works for one marketer might not be what works for another.
That’s why testing is one of the keys to successful sales pages.
With A/B testing, you can put your and your team’s ideas to the test.
If there’s something that’s not working on your website or you want to improve it, you can always conduct tests and determine whether one idea is better than the other.
Ideally, testing should take months to see tangible results, but you might not have that much time.
Weeks or even days of testing might suffice, especially if you are experiencing much traffic.
But you can start to understand your customer’s behaviour if you do the right tests.
And these tests can range.
From small changes like changes to website copy to large-scale changes like design alterations and others.
Each marketer should do their A/B testing and shouldn’t rely on the testing of other people.
Each site has unique visitors and customers, so the best way to understand them is to do the right tests.
4 – Break Down Your Audience with Google Analytics
One area where Analytics can help you understand your customers is through the segmentation of your users.
Google will help you gather your customers’ data, such as age, location, demographics, browsing behaviours, and more.
These predictors allow you to segment your customers and create customer groups.
It will allow you to target your customers quickly and more effectively.
Creating campaigns and your brand story will be much easier once you understand who most of your audience is – how old they are, how they browse, what products they are interested in, and where they come from.
It’s a critical metric that you need to understand as a seller.
After all, who would buy your products if you don’t know whom to target with your advertising?
It will be much easier for you to track your campaigns’ progress and how successful it is.
Copywriting for your products will become seamless, and everything should start to make sense.
Try to get a glimpse of who is visiting your site and who is interested in your products.
Sure, some sellers will find that their customer base is quite diversified, where segmentation comes into play.
5 – User Flows Allow You See The Conversion Funnel on Your Website
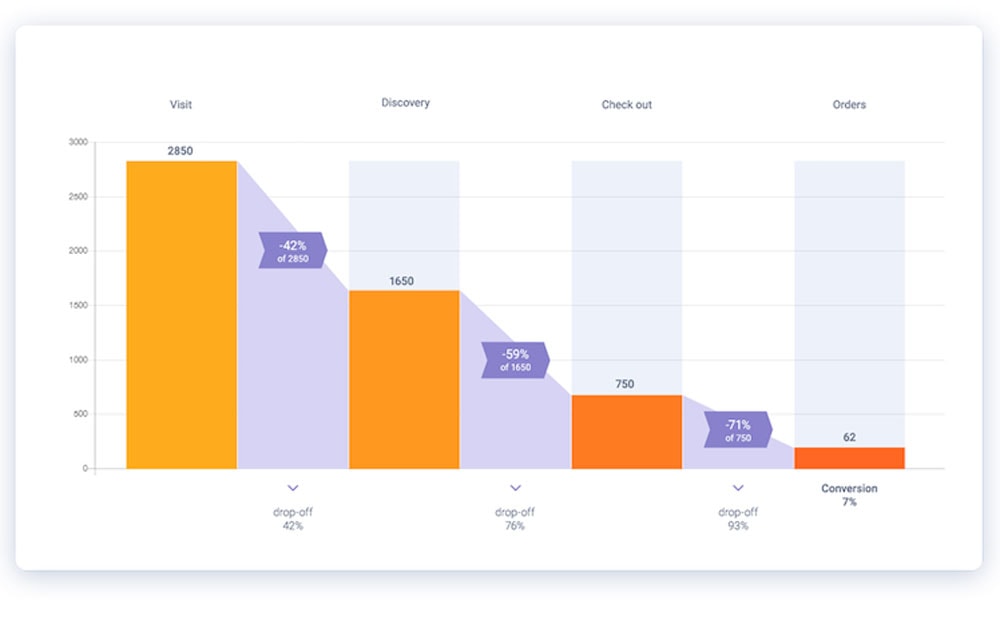
User flows are perfect for analysing and tracking your visitors through your funnel.
You will find that with flows, you’ll know exactly where users get stuck and what part of your website needs improving.
It’s normal to see the flows drop through the several stages of your conversion funnel.
However, your job is to find the leaks and repair those leaks to maximise the conversions on your site.
And that can be easier said than done when you don’t know where the leaks are.
With flows, you’ll know exactly where the problem lies.
Typically, the drop rate increases after the first interaction on your website.
Maybe there’s something wrong with the design?
Or, perhaps the CTA buttons are not visible enough for the visitors?
Or the products themselves don’t look that appealing?
The best way to learn that is with other web analytics tools that we’ve just discussed above.
Doing some A/B testing might make much sense, too.
Try changing the copy on your website, adding better product photos, and putting some life into your website.
And most importantly, make the CTA buttons as visible as possible and as distinct as they can be.
Wrapping Up
If you want to achieve success in online marketing, you need data.
Learning web analytics is something that you can benefit from as a business.
Monitoring, as well as qualifying your website’s effectiveness, is a must.
Collecting all kinds of numbers or data can be overwhelming.
So, first, ensure to define the product-market fit, and then use quantitative and qualitative data to improve.
Ultimately, web analytics can separate the good sellers from those who never quite get their site going.
Why? Because the sellers or users that use web analytics understand their customers better.
They know who their customers are, what they do, how they browse, and what exactly they are looking for in products and on their website.
And with numbers alone, you can’t predict that.
You can only guess. But with web analytics tools, your life will be much easier.